REPORT LINK
All spatial data are available from the Point No Point Treaty Council http://pnptc.org/, 7999 NW Salish Lane, Kingston, WA 98346
Executive Summary
Using High Spatial Resolution Hyperspectral Imagery to Describe Eelgrass (Zostera marina) Landscape Structure in Hood Canal, WA.
To better manage estuarine resources, it is important to develop a detailed understanding of the ecological processes and interactions that control and regulate populations of organisms, such as anadromous salmon (Oncorhynchus spp.) of the Pacific Northwest (PNW), that depend at some point in their life history upon the integrity of estuarine habitats. In Hood Canal and the Strait of Juan de Fuca, there is considerable evidence (Ames et al., 2000) that juvenile summer chum salmon (O. keta) rely on “natural beaches, eelgrass beds and unimpacted drift cells to provide productive, protected migratory corridors†as they transition from river delta rearing areas to open-water (Simenstad, 2000). Eelgrass beds form a nearly “continuous band†around the lower intertidal and sub tidal regions of Hood Canal from depths of about +1.8 m to –6.6 m (Phillips, 1984). Many factors can affect the quantity and structure of Hood Canal’s eelgrass beds and beaches including: filling, excavation, jetty construction, shoreline development (e.g., bulkhead and dock construction), vegetation destruction (Simenstad, 2000), and eutrophication. In turn, these factors can also affect the fitness of migrating salmon at multiple, interacting spatial and temporal scales (Cracknell, 1999; Simenstad and Cordell, 2000; Simenstad et al., 2000) making it difficult to predict the consequences of these perturbations.
Fortunately, emerging remote sensing and geographic information system (GIS) technology provide new analytical and visualization tools that allow fisheries scientists/managers to integrate multiple spatial data sets over large geographic areas, thereby achieving a landscape perspective appropriate to managing fish habitat.
Perhaps for the first time, it is possible to develop spatial data sets for relative large areas based on remotely sensed data which describe eelgrass habitat structure at the spatial scales over which salmon respond (~ 1 to 5 m).
Recognizing the important ecological role that long, relatively thin (~1-5 m) eelgrass corridors play in juvenile summer chum salmon (Oncorhynchus spp.) migration in Hood Canal, and the limitations of space-borne remote sensing platforms, we initiated this study to determine (1) if it is feasible to develop eelgrass habitat coverages at a spatial scale of 1-2 m using a CASI sensor; and (2) if we could differentiate between spectrally similar, co-occurring vegetation (i.e., eelgrass and green macroalgae).
The broader purpose of this study is to relate the landscape structure of the intertidal eelgrass to shoreline modifications as a quantitative index of essential habitat quality for migrating juvenile summer chum salmon. Since we planned to incorporate resulting data into GIS, we were also interested in determining if the CASI imagery (a two-dimensional, charge couple device, array based push broom imaging spectrograph) could be geometrically corrected to approximately the same spatial scale as the image resolution. (~5- 10 m).
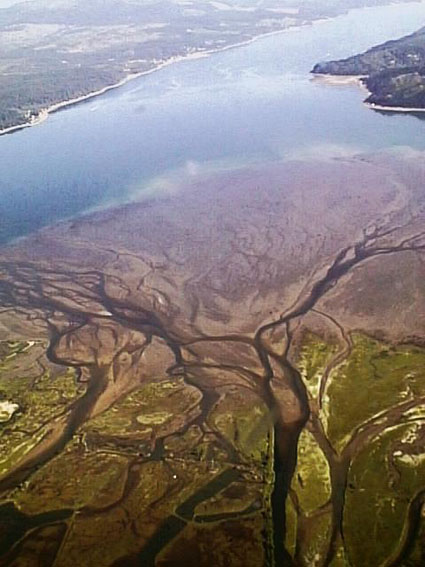
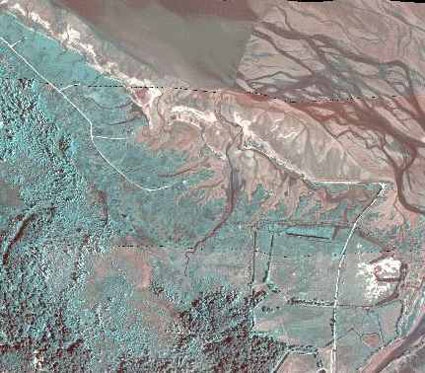
The ability to resolve estuarine habitat features depends on the spatial and spectral resolution of the imagery.
Project Description
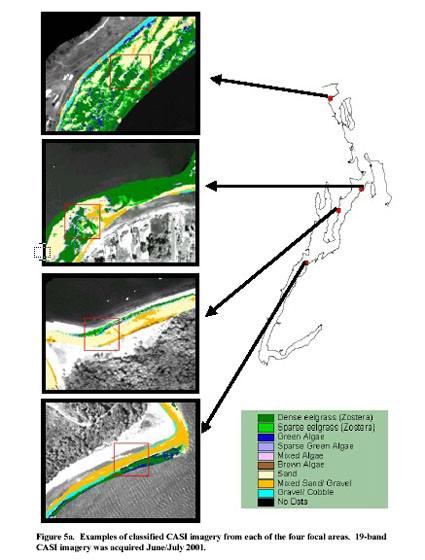
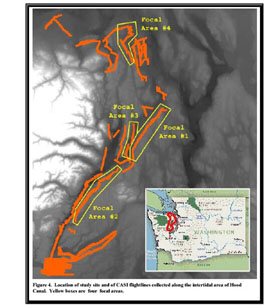
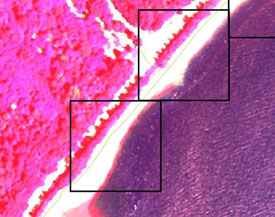
We collected 19-band CASI imagery along the shoreline of Hood Canal during (+/- 3 hr) a spring low tide series from 29 June to 5 July 2000. We collected 145 overlapping flightlines ranging in length from approximately 0.9 to 20.0 km along most (~70%) of the shoreline Each pixel represented an area of 2.25 m^2 on the ground. Initial processing of 19 flightlines in four non-contiguous focal areas covered approximately 84.3 km of Hood Canal shoreline.
We geocorrected the CASI imagery to +/- 4.8m to 23.5 m RMSE using GCP targets and DOQ features visible in the imagery.
We found good agreement between classified eelgrass polygons and existing eelgrass beds. For the most of the other habitat classes, there was also good agreement except for the oyster bed cover class (Focal Areas 1-3) and the Brown Algae class (FocalArea 4). Our inability to correctly separate oyster beds from wet sand/gravel/cobble and brown algae was most likely due to the relatively low number of training sites. In addition, ‘’sand’ and ‘mixed sand/gravel’ classes, separated in Focal Area 4, were combined in Focal Areas 1-3 primarily due to differing degrees of wetness. We did not pursue improving the classification of non-eelgrass habitat types since they were not the primary objective of this study.
