REPORT LINK
June 2004
Executive Summary
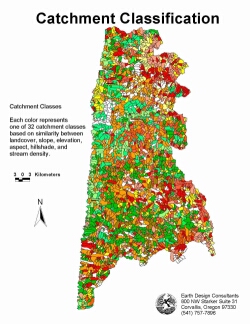
Monitoring is an essential component of watershed management. However, it is often difficult to link watershed components with instream monitoring projects. Advances in computer technology have provided a tool, geographic information systems, which can be used to develop watershed-wide perspective on factors that affect aquatic resources such as salmon and water quality. The goal of this project is to build a monitoring framework by characterizing catchments (subbasins) MidCoast Region of Oregon. We used GIS to summarize the physical and biologic properties of topographically defined catchments approximately 300 acres in size. Descriptive multivariate statistics were used to objectively classify catchments into meaningful categories. Monitoring can then be planned for catchments sharing similar characteristics.

Approach
Task 1. Generation of ArcView Catchment Layer.
We began by deriving catchments smaller than the 6th field watersheds. The average 6th field watershed is 1,718 hectares within our study area (MidCoast Region of Oregon). In order to examine the landscape at a finer spatial scale we used 10 m DEM’s (digital elevation models) to derive a new layer of catchments with an average area of 100 hectares. Our final layer contained 3,649 catchments.
Task 2. Analysis of Data Matrix I
We constructed a data matrix by summarized the following attribute for each catchment: land cover, slope, elevation, aspect, hillshade, and stream density. The parameters elevation, aspect, and hillshade were added after a discussion of the potential interest in examining stream temperature. These data were analyzed using descriptive multivariate statistics (i.e., cluster, ordination). Our initial runs described 32 groups of distinct catchment types.
We examined current instream monitoring programs to determine how well existing study sites capture the range of catchment types. This information will be useful in guiding the selection of future monitoring locations.
Task 3. Analysis of Data Matrix II.
We constructed a second data matrix that included information on stream gradient and confinement. Currently, these data do not exist for the entire study area.
Task 4. Comparison of catchment types with biological data.
Finally, determined if catchment types covary with patterns in the abundance and distribution of important instream biota.
